
WTO: 2013 PRESS RELEASES
PRESS/688
PRESS RELEASE
MORE:
> 2013 press releases
MAIN POINTS
The abrupt deceleration of trade in 2012 was attributed to slow growth in developed economies and recurring bouts of uncertainty over the future of the euro. Flagging output and high unemployment in developed countries reduced imports and fed through to a lower pace of export growth in both developed and developing economies.
Improved economic prospects for the United States in 2013 should only partly offset the continued weakness in the European Union, whose economy is expected to remain flat or even contract slightly this year according to consensus estimates.
China’s growth should continue to outpace other leading economies, cushioning the slowdown, but exports will still be constrained by weak demand in Europe. As a result, 2013 looks to be a near repeat of 2012, with both trade and output expanding slowly, below their long-term average rates (Chart 1).
“The events of 2012 should serve as a reminder that the structural flaws in economies that were revealed by the economic crisis have not been fully addressed, despite important progress in some areas. Repairing these fissures needs to be the priority for 2013,” Director General Pascal Lamy said.
“Attempts by developed economies to strike a balance between short-term growth and increasingly binding fiscal constraints have produced uneven results to date, and finding an appropriate mix of policies has proven to be challenging. Similarly, the amount of progress that developing economies have made in reducing their reliance on external demand is still unclear.
“As long as global economic weakness persists, protectionist pressure will build and could eventually become overwhelming. The threat of protectionism may be greater now than at any time since the start of the crisis, since other polices to restore growth have been tried and found wanting.
“To prevent a self-destructive lapse into economic nationalism, countries need to refocus their attention on reinforcing the multilateral trading system. Trade can once again be an engine of growth and a source of strength for the global economy rather than a barometer of instability. The way is before us, we only need to find the will,” Mr Lamy said.
Chart1: Growth in the volume of world merchandise trade and GDP, 2005-14a
Annual % change
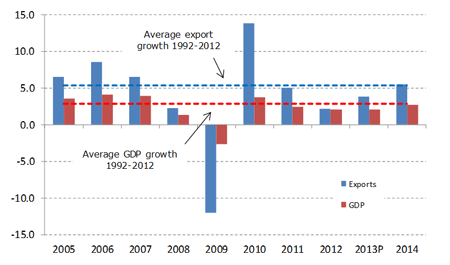
a Figures for 2013 and 2014 are projections.
Source: WTO Secretariat.
The preliminary estimate of 2.0% growth for world trade in 2012 is 0.5 points below the WTO’s most recent forecast of 2.5% from September 2012. The deviation is mostly explained by the worse than expected second-half performance of developed economies, which only managed a 1% increase in exports and a 0.1% decline in imports for the year. The growth of exports from developing economies (which for the purposes of this analysis includes the Commonwealth of Independent States) was in line with earlier predictions, but the rate for imports was less than expected. WTO economists cautioned that their trade forecasts for 2013 and 2014 were difficult to gauge due to divergent outlooks for the US and EU.
These figures refer to merchandise trade in volume terms, i.e., adjusted to account for inflation and exchange rate movements, but nominal (dollar-value) trade flows for both merchandise and commercial services display similar trends.
In 2012, the dollar value of world merchandise exports only increased two tenths of one per cent (i.e. 0.2%) to $18.3 trillion, leaving it essentially unchanged. The slower growth in the dollar value of world trade compared to trade in volume terms is explained by falling prices for traded goods. Some of the biggest price declines were recorded for commodities such as coffee (–22 %), cotton (–42%), iron ore (–23%) and coal (–21%), according to IMF commodity price statistics.
The value of world commercial services exports rose just 2% in 2012 to $4.3 trillion, with strong differences in growth rates across countries and regions. For example, the US saw its exports of commercial services climb 4% while those of Germany dropped 2% and France’s tumbled 7%. On the import side, several European countries recorded sharp declines, including Italy (–8%), France (–10%), Portugal (–16%) and Greece (–18%).
The trade forecast for 2013 assumes 2.1% growth in world output at market exchange rates (unchanged from 2012) based on a consensus of economic forecasters. Risks to the forecast are firmly rooted on the downside and are mostly linked to the sovereign debt crisis in Europe.
Accelerated fiscal consolidation in the US could also undermine the forecast if brinksmanship over budget negotiations between the executive and legislative branches leads to miscalculation. As always, unexpected events such as geopolitical tensions and natural disasters could also intrude to disrupt trade.
On a more positive note, some factors that held back trade growth in 2012 may subside in 2013, including the recent territorial dispute that soured trade relations between Japan and China.
Indicators of production, business sentiment and employment in the first quarter of 2013 paint a mixed picture of current economic conditions. Purchasing managers’ indices suggest that the euro-zone downturn may have accelerated despite continued resilience in Germany. At the same time, the US recorded a strong rise in manufacturing, Japan’s production growth was less negative, and China and the Republic of Korea showed modest improvements.
Unemployment in the US recently fell to its lowest level since before the economic crisis at 7.6%, whereas the rate for the euro area stands at close to 12%. Together, these indicators point to weak import demand in Europe even as conditions gradually improve elsewhere. In light of the large weight of the EU in world imports (32% in 2012 including trade within the EU, 15% excluding it), this suggests slow growth for trade in the early part of 2013.
More details on trade developments in 2012
WTO statistics on short-term trade developments illustrate the divergent trade performances of major economies over the course of 2012. Chart 2 shows seasonally-adjusted quarterly merchandise trade volume indices for the US, the EU, Japan and developing Asia (including China). Exports from the US and from the EU to the rest of the world (i.e. EU-extra exports) remained relatively strong for most of the year before dipping slightly in the fourth quarter (Q4). Asian exports also held up relatively well, finishing the year on a positive note after pausing in the third quarter (Q3).
Meanwhile, Japan’s shipments of goods dropped 11% in the last two quarters of the year. This downturn appears to have been caused by a deterioration of Japan’s trade with China. Annual figures on merchandise trade in dollar terms show that the value of Japan’s exports declined by 3% in 2012. However, shipments to China, which represent around 20% of the country’s exports, were down 11% year-on-year, while exports to other destinations only declined by 1%.
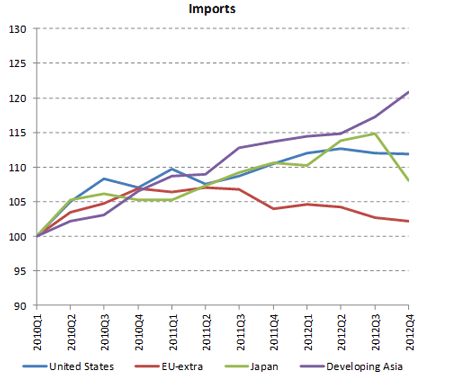
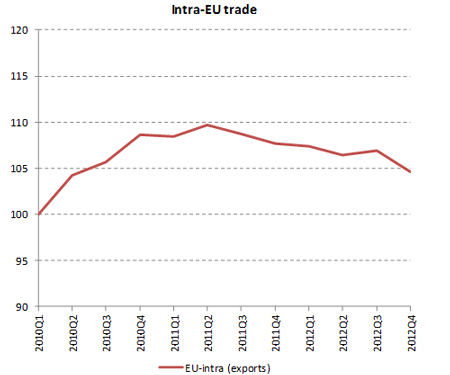
On the import side, the EU maintained its recent downward trajectory, with Q4 imports from the rest of the world falling to 5% below their level in the middle of 2011, and imports from other EU countries (i.e. intra-EU trade) slipping by the same amount.
Japanese imports recorded strong growth for most of the year before dropping 6% in Q4. The rise in imports in the earlier quarters was partly due to increased purchases of fuels from abroad for use in conventional thermal electricity generation following the loss of output from nuclear power stations after the Fukushima disaster. The dollar value of Japanese imports rose 3.5% in 2012, but imports from Saudi Arabia were up 8% and purchases from Qatar (mostly natural gas) rose 19%. Japan’s merchandise trade deficit of $87 billion for 2012 was the largest ever recorded for the country in a dataset stretching back to 1948.
Quarterly developments for trade in commercial services show a similar pattern to trade in goods, with year-on-year growth in dollar values flat or
Chart 2 — Quarterly merchandise trade flows of
selected economies, 2010Q1-2012Q4
Seasonally adjusted volume indices, 2010Q1=100
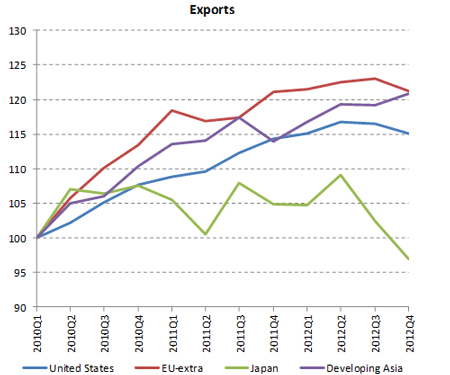
Source: WTO Short-term trade statistics.
declining in Europe and growing in other regions. For more short-term trade statistics, visits the WTO’s statistics portal.
The growth of world merchandise trade in 2012 was much lower than one would expect given the rate of world gross domestic product (GDP) growth for the year. Under normal conditions, the growth rate for trade is usually around twice that of GDP, but in 2012 the ratio of trade growth to GDP growth fell to 1:1. We foresee no change in world GDP growth for 2013 but we do anticipate a partial return toward the usual ratio of trade growth to GDP growth. In 2013 it should increase to 1.6:1 and then to 1.8:1 in 2014.
Despite the unusually slow rate of trade volume growth in 2012, the ratio of world exports of merchandise and commercial service to world GDP in current dollar terms only dipped slightly, from around 32%, and remained close to its peak value of 33% in 2008 (Chart 3).
Finally, it should be noted that slowing economic growth in Europe has a disproportionate impact on world trade due to the fact that by convention we include trade between EU countries in world trade totals. However, if we were to treat the EU as a single entity, which it is for purposes of trade policy, the slowdown in world trade in 2012 would not appear as extreme. In this case world trade growth would be 3.2% in 2012 rather than 2.0%.
Chart 3: Ratio of world exports of merchandise and commercial services to world GDP, 1980-2012
ratio of current $ values
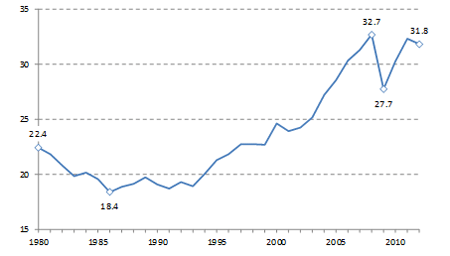
Source: IMF world GDP, WTO Secretariat for merchandise trade, WTO Secretariat and UNCTAD for commercial services.
Additional perspective on the trade forecast
The WTO’s forecast of 3.3% growth in merchandise trade for 2013 is below the average rate of 5.3% for the last 20 years (1992–2012) and well below the pre-crisis average rate of 6.0% (1990–2008) (Chart 4). The divergence from the 20-year average narrows in the 2-year-ahead forecast for 2014 (5.0%), but it still remains below average. The difference between the pre-crisis trend and current and projected values for world trade appears to be widening, albeit slowly. If our forecast comes to pass, the gap in percentage terms will be 17.0% in 2013 and 17.8% in 2014.
At some point in the future trade growth will again surpass its 20 year average, if only because this average keeps falling with every passing year of sub-par growth. When or if it will manage to bridge the gap with its pre-crisis trend remains to be seen. In addition to a durable level shift in the series, it appears that the fundamental growth rate of world trade volumes has also been reduced. To return to this trend would require a period of very rapid trade expansion at some point in the future, but such a boom in trade does not appear likely any time soon.
Chart 4: Volume of world merchandise exports, 1990-2014a
Indices, 1990=100
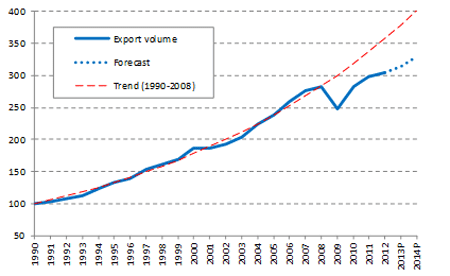
a Figures for 2013 and 2014 are projections.
Source: WTO Secretariat
The state of the world economy and trade in 2012
Economic growth
Economies in the euro area stalled in 2012 and the sovereign debt crisis flared again in the summer, pushing long-term borrowing costs for Italy and Spain above 6% and stoking uncertainty about the future of the common currency (Chart 5). Growth also slowed worryingly in the US in Q4, and Japan slipped in and out of recession during the year. As a result, world GDP growth at market exchange rates dropped to 2.1% in 2012 from 2.4% in 2011. This pace of expansion was below the average of 3.2% for the two decades preceding the financial crisis and also below the 2.8% average of the last 20 years including the crisis period (Table 1).
Policy responses from the European Central Bank and the Federal Reserve appear to have succeeded in easing the sovereign debt crisis and putting US growth on a firmer footing. Borrowing costs in the euro area have returned to manageable levels since September and joblessness in the US has begun to fall, but progress to date remains fragile.
The 2.3% growth in the US was nearly double the 1.2% rate for developed economies as a whole in 2012. Japan’s increase for the year was also above average at 1.9%, but the EU’s growth was close to zero at –0.3%.
Chart 5: Long-term interest rates on euro area sovereign debt, July 2008 — February 2013 a
Period average % per annum
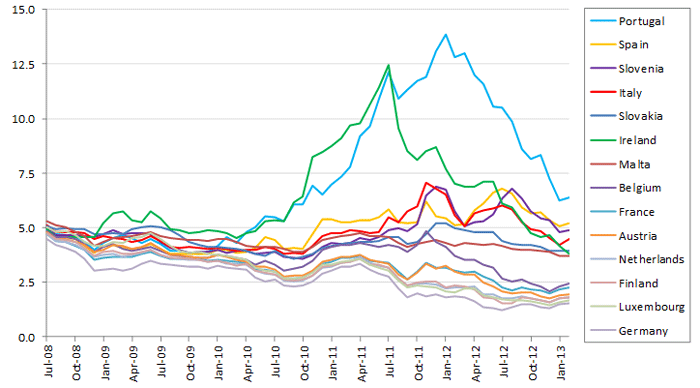
a Secondary market yields on 10-year government bonds issued by all euro area governments except Estonia, Greece and Cyprus, sorted in descending order by rates in February 2013.
Source: European Central Bank
Developing countries and the Commonwealth of Independent States (CIS) collectively raised their output by 4.7% in 2012, with Africa recording the fastest growth of any country or region at 9.3%. China was not far behind at 7.8%, while India recorded a 5.2% increase. However, the newly industrialized Asian economies of Hong Kong (China), the Republic of Korea, Singapore and Chinese Taipei registered a disappointing 1.8% increase as slumping European demand penalized their exports.
The next fastest growing region after Africa was Asia (3.8%) followed by the CIS (3.7), the Middle East (3.3%), South and Central America (2.6%), North America (2.3%) and Europe (–0.1%). Aggregate quarterly figures for world GDP growth are not readily available, but such growth likely slowed toward the end of the year as output in the EU contracted in Q4 and US and Japanese growth slowed.
Table 1: Real GDP and merchandise trade volume growth by region, 2010-12
Annual % change
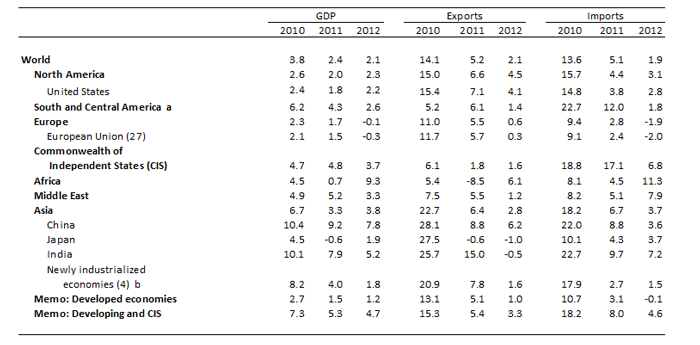
a Includes the Caribbean
b Hong Kong, China; Republic of Korea; Singapore and Chinese Taipei
c Hong Kong, China; Republic of Korea; Singapore and Chinese Taipei.
Source: WTO Secretariat.
Merchandise trade in volume (i.e. real) terms
The volume of world merchandise trade (as measured by the average of exports and imports) registered an increase of just 2% in 2012. If we exclude years in which trade volume declined, this was the smallest annual increase in a dataset extending back to 1981. Shipments from developed countries grew more slowly than the world average at 1.0%, while exports of developing economies grew faster at 3.3%. On the import side, developed economies dropped 0.1% last year, while developing economies grew at a 4.6% pace (Table 1).
After seeing its exports shrink by 8.5% in 2011 following the Libyan civil war, Africa rebounded in 2012 to record the fastest export growth of any region at 6.1%. This was followed by North America, where exports rose 4.5% on the strength of a 4.1% increase the US. Asia only managed to increase its exports by 2.8% in 2012 despite 6.2% growth in China’s exports. Contributing to the slow growth in Asia were India and Japan, where exports declined by 0.5% and 1.0%, respectively. Other regions that export large quantities of natural resources saw small increases in export volumes, including the Commonwealth of Independent States (1.6%), South and Central America (1.4%), and the Middle East (1.2%). This is to be expected since quantities of primary products tend not to change very much from year to year. The region with the slowest export growth was again Europe at 0.6%, but the EU managed to grow even more slowly at 0.3%.
Africa’s imports also grew faster than those of any other region at 11.3%, making it the only region with double digit growth in either exports or imports. This was followed by the Middle East (7.9%) and the Commonwealth of Independent States (6.8%), which took advantage of the high average oil prices in 2012 to boost their export earnings to purchase more imports (Table 2). Asia’s import growth of 3.7% was driven by a 3.6% increase in China. North America’s 3.1% rise was slightly stronger than that of the US (2.8%). South and Central America, with import growth of 1.8%, lagged behind all regions other than Europe, which recorded a 1.9% decline in imports.
Table 2: World prices of selected primary products, 2000-12
Annual % change and $/Barrel
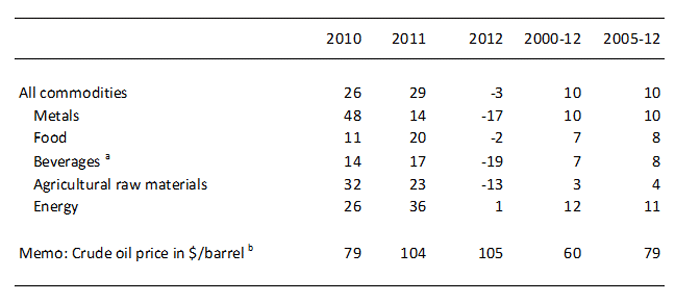
a Comprising coffee, cocoa beans and tea.
b Average of Brent, Dubai, and West Texas Intermediate.
Source: IMF International Financial Statistics.
Merchandise and commercial services trade in value (i.e. dollar) terms
The dollar value of world merchandise exports in 2012 was $18.3 trillion, nearly unchanged from 2011. The stagnation in values reduced the average growth rate for the post-2005 period to 8% from 10% last year. This contrasts with the stronger growth rates of 22% in 2010 and 20% in 2011. Meanwhile, world commercial services exports in 2012 were only 2% higher than in 2011 at $4.3 trillion. The 2012 growth rate for transport services was in line with total world commercial services exports at 2%, while travel services grew faster (4%) and other commercial services grew more slowly (1%) (Table 3).
Commercial services accounted for roughly 19% of total world trade in world goods and commercial services in 2012. However, it should be noted that traditional trade statistics, which measure gross trade flows rather than value added at various stages of production, strongly underestimate the contribution of services to international trade. A joint initiative between the WTO and the Organisation for Economic Cooperation and Development (OECD) has developed new indicators of trade in value added that provide additional perspective on the role of services in world trade. More information can be found on the WTO’s website, here: www.wto.org/miwi
Table 3: World exports of merchandise and commercial services, 2005-12
$bn and annual % change
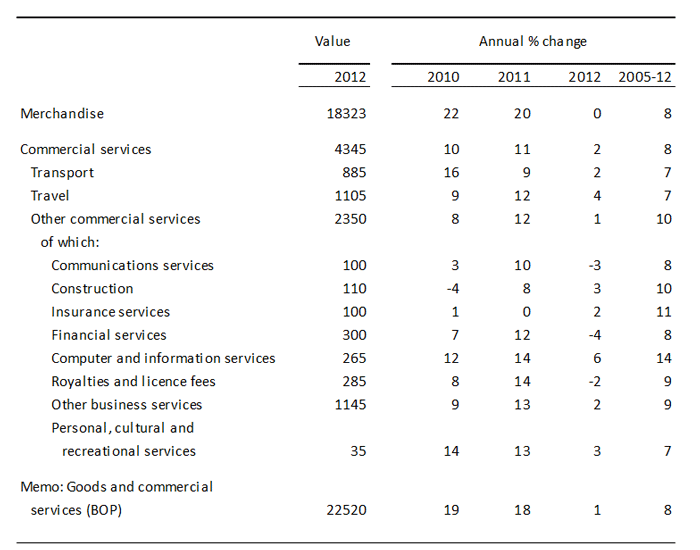
Source: WTO Secretariat estimates for merchandise and WTO and UNCTAD Secretariat estimates for commercial services.
Some sub-categories of other commercial services grew faster than others. Communications (including postal, courier and telecommunications services) declined by 3%, while construction rose 3% and insurance services increased by 2% in 2012. The biggest decline was observed in financial services (i.e. services provided by banks and other financial intermediaries), which fell 4%. The fastest growing sub-sector of other commercial services was computer and information services, which jumped 6% in 2012. Royalties and licence fees fell 2%, and other business services (including engineering services, legal/accounting services, management consulting, advertising and trade related services, among others) increased by 2%.
In dollar terms, US exports of financial services declined by 4% in 2012, the United Kingdom dropped 13%, Germany slipped 2% and France plunged 20%. Several other EU countries also recorded double digit declines in financial services, including Austria (–11%), Cyprus (–21%), Greece (–29%) and Spain (–11%). Total exports of financial services from Switzerland declined by 8%. Meanwhile, Japan’s exports of financial services gained 13% and China’s advanced 58%. Finally, the Asian financial centres of Singapore and Hong Kong, China treaded water in 2012 with 0% and 4% growth, respectively. 1
Overall, developed economies’ exports of financial services fell 6% while those of developing economies and Commonwealth of Independent States together rose 3%.
The US dollar appreciated against most major currencies between 2012 and 2013, rising nearly 4% on average according to data from the Federal Reserve Bank of St. Louis (Chart 6). Exceptions include the Chinese yuan, which appreciated 2.4% against the dollar, and the Japanese yen, which was more or less unchanged against the dollar (-0.2%). This would tend to understate the value of some trade flows in 2013 and overstate the magnitude of any declines from 2012, particularly for trade not denominated in dollars (e.g. trade within the EU).
Chart 6: Trade weighted US dollar exchange rate against major currencies, Jan. 2010 — Feb. 2013
Index, Jan. 2012=100
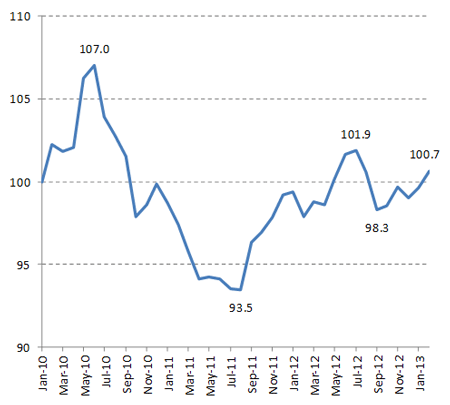
Source: Federal Reserve Bank of St. Louis.
Appendix tables 1 to 6 provide detailed information on nominal merchandise and commercial services trade flows by region and for selected economies. They also include tables of leading exporters and importers with and without trade between EU states. There were few significant moves up or down in world rankings last year. France overtook China as an exporter of commercial services compared to last year’s tables, but this was due to changes in data coverage rather than an improved export performance in France. Maps 1 and 2 show shares of regions in world exports and imports of merchandise and commercial services.
Sectoral merchandise trade developments
Chart 7 shows estimated year-on-year growth in the dollar value world trade for major categories of manufactured goods. It illustrates the fact that some products declined earlier and recovered sooner than others during the trade collapse of 2009. In the case of the current trade slowdown, it may provide an indication of whether trade is still slowing or has already bottomed out and started to recover.
Iron and steel trade appears to be a highly pro-cyclical and somewhat lagging indicator of global trade growth. It registered the biggest declines of any sector during both the 2009 trade collapse and the recent slump. Although it was down 11% year-on-year in the fourth quarter of 2012, this was less negative than the previous quarter, when it was down 13%.
Year-on-year growth in office and telecom equipment was –1% in the second quarter and 0% in the third, but in the fourth it returned to positive territory with an increase of 6%. This sector led the recovery following the 2009 trade collapse, so its return to growth is a positive sign for a revival of trade in the coming months.
Most other sectors saw improvements in year-on-year growth between the third and fourth quarters, which suggest that a recovery in trade may be under way. Chemicals increased from –6% to 0%, industrial machinery rose from –3% to –2%, and clothing and textiles went from –8% to –1%. An important exception is automotive products, which tend to be a coincident indicator of trade cycles. This category was down 2% in both the third and fourth quarters, showing no improvement.
Chart 7: Quarterly world exports of manufactured goods by product, 2008Q1-2012Q4
Year-on-year % change in current $ values
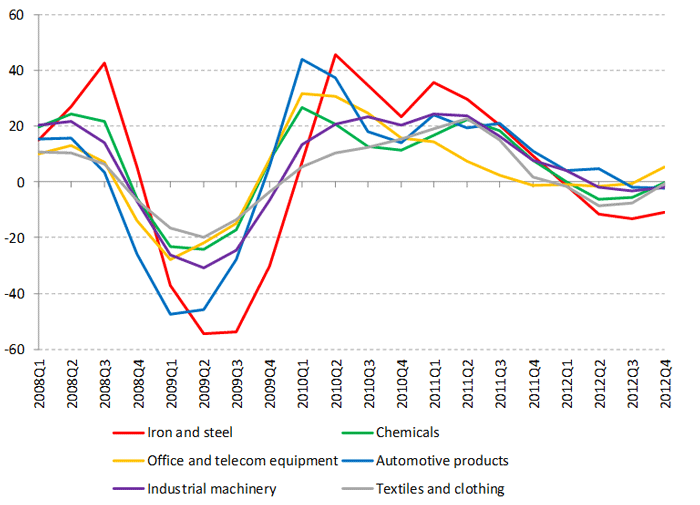
Source: WTO Secretariat estimates based on mirror data for available reporters in the Global Trade Atlas database, Global trade Information Systems.
Prospects for 2013 and 2014
The outlook for world trade and output in 2013 and 2014 looks unsettled, as positive economic trends have also been accompanied by more worrisome developments.
EU output fell in the fourth quarter of last year as the slowdown in Europe finally touched Germany. Monthly indicators of economic activity in January and February suggest that the German economy remained relatively resilient in the first quarter, but the downturn in the rest of the euro area appeared to be intensifying. Most forecasters expect European economies to remain weak in the first half of 2013 before gaining strength later in the year.
Unemployment is falling gradually and private expenditure is picking up in the US, but automatic government spending cuts set to take effect in 2013 could weigh on growth later in the year. Political gridlock may be easing, which could allow more targeted and less sweeping measures to be agreed, with less risk to a promising recovery. The Federal Reserve has signalled that its most recent program of quantitative easing will not be withdrawn hastily, but as the economy picks up transitioning to a less accommodative policy stance could prove challenging.
Japan’s new government has prioritized a sizeable fiscal stimulus package and a more accommodative monetary policy as a way to spur economic growth. The former may test the limits of fiscal policy given the size of the country’s public debt — estimated by the IMF to exceed 200% of GDP — while the latter may invite charges of currency manipulation. Stimulus-oriented policies will probably provide a boost to Japanese growth and trade in 2013, but how much remains to be seen.
Although China’s exports may be hindered by the slowdown in Europe, increased shipments to the US should partly make up for this. Until recently the EU was China’s largest trading partner, but the drop in EU imports in 2012 left it in second place behind the US. China’s GDP growth is expected to remain strong compared to the rest of the world in 2013, which should provide support for imports from other countries.
In light of these developments, WTO economists are forecasting a small pickup in world trade volume growth to 3.3% in 2013 from 2.0% in 2012. Exports of developed economies should increase by 1.4% while those of developing economies (including the Commonwealth of Independent States) should rise 5.3%. On the import side, the WTO anticipates 1.4% growth in developed economics and 5.9% in developing economies plus CIS. (See Table 4.)
Figures for 2014 are provisional estimates based on strong assumptions about the medium-term trajectory of gross domestic product (GDP) and should be interpreted with care. World trade volume growth for that year is expected to improve to 5.0%. Exports of developed and developing economies should increase by 2.6% and 7.5%, respectively. On the import side, developed economies should advance by 3.2% while developing economies should rise 7.4%.
The current forecast could be derailed if certain downside risks materialize. These include revived financial market turbulence related to the euro crisis, commodity price spikes, geopolitical tensions, and rising protectionism.
Table 4: World merchandise trade and GDP, 2008-2014a
Annual % change
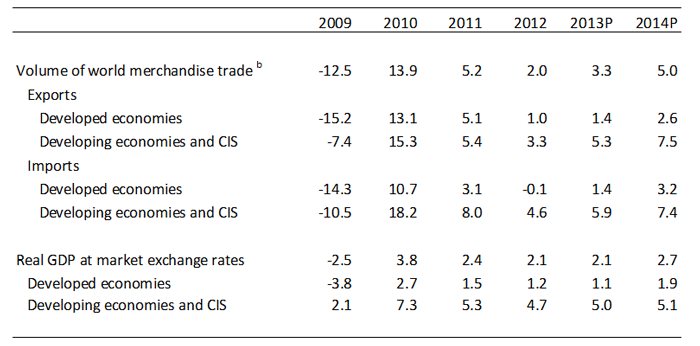
a Figures for 2012 and 2013 are projections.
b Average of exports and imports.
Source: WTO Secretariat for trade, concensus estimates of economic forecasters for GDP.
Trade could still surprise on the upside if Europe returns to growth more quickly than anticipated. However, the most likely result is very similar to last year: a mild recession in the EU restraining exports and imports in both developed and developing economies.
The trade forecast assumes a 2.1% increase in world GDP for 2013, with developed economies growing 1.1% and the rest of the world growing 5.0%. The 2014 projection assumes world output growth of 2.7%, with developed economies advancing 1.9% and the rest of the world growing 5.1%. The output figures above refer to real GDP at market exchange rates based on consensus estimates of economic forecasters.2
These estimates of export growth are supported by results from of the WTO Secretariat’s quarterly time series forecasting model, which predicts an increase of around 2.5% in imports of goods and services for OECD countries in 2013 (Chart 8).3 Difference between the two approaches can be explained by the use of different weights in the two models (GDP weights vs. trade weights) and by the fact that the WTO’s definition of developed economies differs from the membership of the OECD.
Chart 8: GDP and import demand for OECD countries, 2008Q1-2012Q4a
Annualized % change over previous quarter
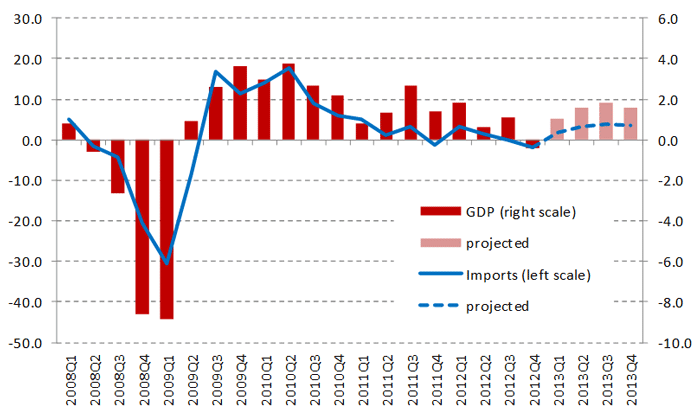
a Figures for 2012 and 2013 are projections.
Source: OECD for trade and GDP through 2011Q4. Consensus estimates of forecasting agencies for GDP
projections and WTO Secretariat for trade forecasts.
> Download this press release (pdf format, 27 pages, 313KB)
> Problems viewing this page?
Please contact [email protected] giving details of the operating system and web browser you are using.
Map 1: Merchandise exports and imports in current US dollars by region, 2012a
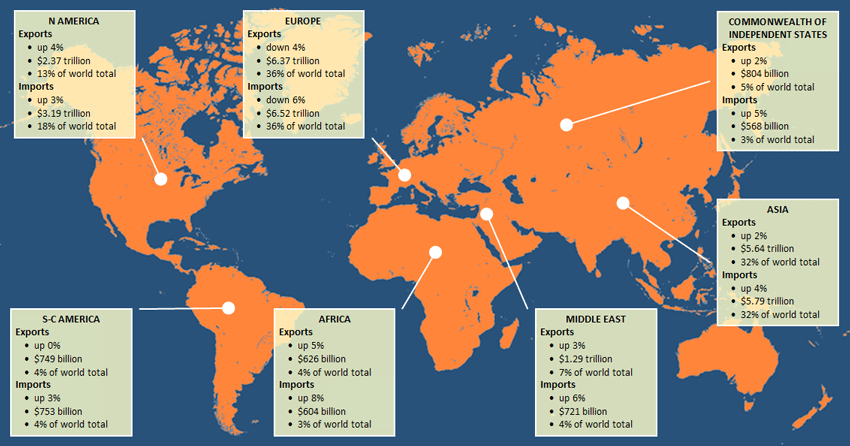
a Values and shares include intra-EU trade.
Source: WTO Secretariat.
Map 2: Exports and imports of commercial services in current US dollars by region, 2012
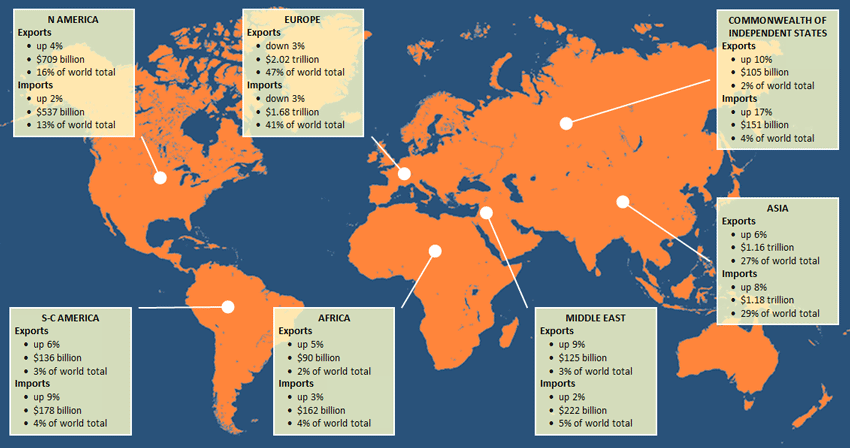
a Values and shares include intra-EU trade.
Source: WTO and UNCTAD Secretariats.
Appendix Table 1
World merchandise trade by region and selected economies, 2012
$bn and %
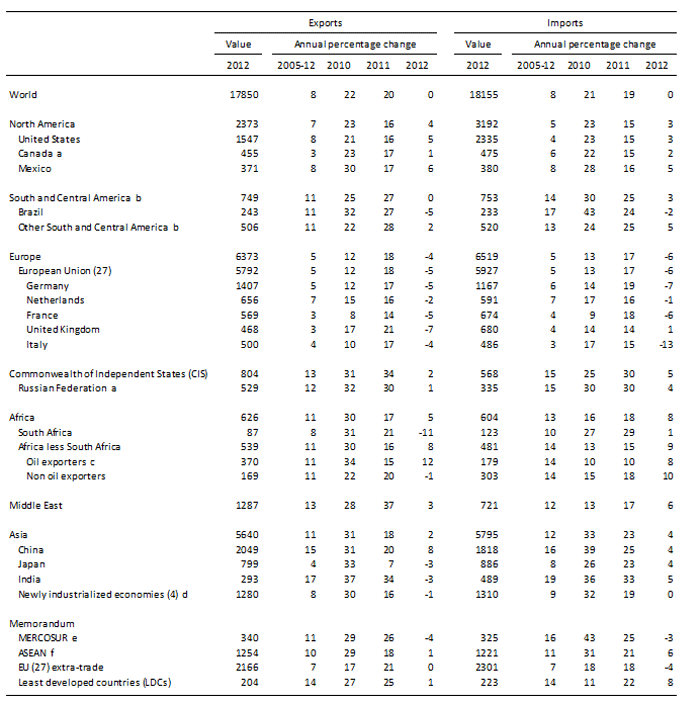
a. Imports are valued f.o.b.
b. Includes the Caribbean. For composition of groups see the Technical Notes of WTO, International Trade Statistics, 2012.
c. Algeria, Angola, Cameroon, Chad, Congo, Equatorial Guinea, Gabon, Libya, Nigeria, Sudan.
d. Hong Kong, China; Republic of Korea; Singapore and Chinese Taipei.
e. Common Market of the Southern Cone: Argentina, Brazil, Paraguay, Uruguay.
f. Association of Southeast Asian Nations: Brunei, Cambodia, Indonesia, Laos, Malaysia, Myanmar, Philippines, Singapore, Thailand, Viet Nam.
Source: WTO Secretariat.
Appendix Table 2
World trade of commercial services by region and selected country, 2012
$bn and %

a Includes the Caribbean. For composition of groups see Chapter IV Metadata of WTO International Trade Statistics, 2012.
b. Secretariat estimates.
c. Preliminary estimates.
... indicates unavailable or non-comparable figures.
Note: While provisional full year data were available in mid March for some 50 countries accounting for more than two thirds ofworld commercial services trade, estimates for most other countries are based on data for the first three quarters.
Source: WTO and UNCTAD Secretariats.
Appendix Table 3
Merchandise trade: leading exporters and importers, 2012
$bn and %
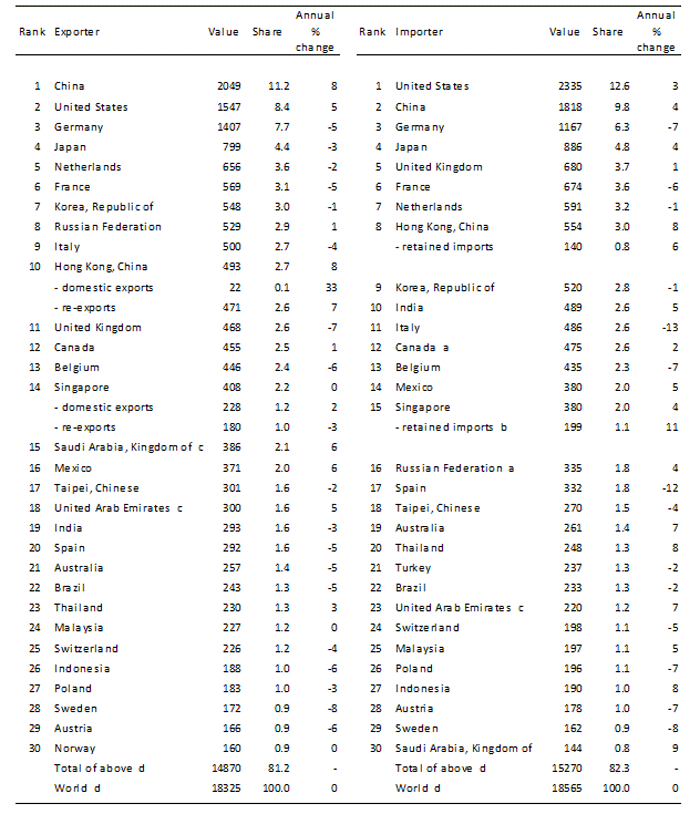
a. Imports are valued f.o.b.
b. Singapore’s retained imports are defined as imports less re-exports.
c. Secretariat estimates.
d. Includes significant re-exports or imports for re-export.
Source: WTO Secretariat.
Appendix Table 4
Merchandise trade: leading exporters and importers (excluding intra-EU (27) trade), 2012
$bn and %

a. Imports are valued f.o.b.
b. Singapore’s retained imports are defined as imports less re-exports.
c. Secretariat estimates.
d. Includes significant re-exports or imports for re-export.
Source: WTO Secretariat.
Appendix Table 5
Leading exporters and importers in world trade in commercial services, 2012
$bn and %
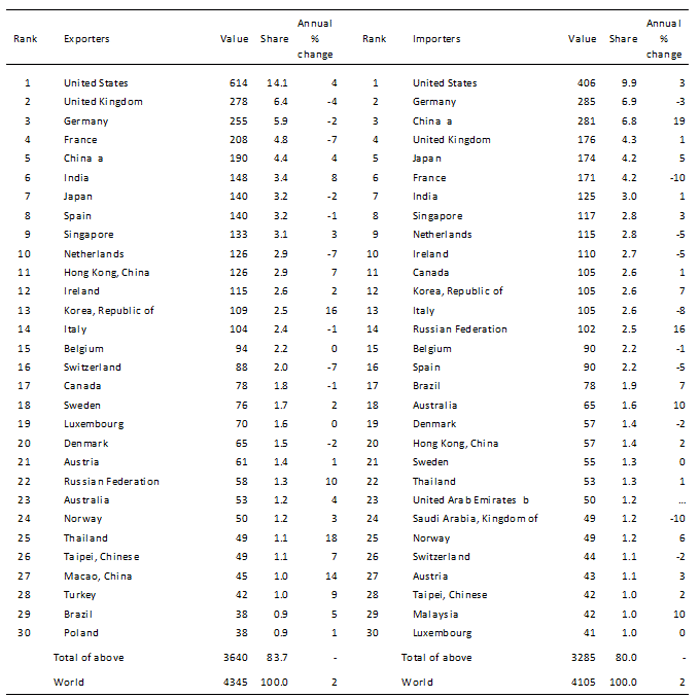
a Preliminary estimates.
b Secretariat estimate.
… indicates unavailable or non-comparable figures.
- indicates non-applicable.
Note: Figures for a number of countries and territories have been estimated by the Secretariat. Annual percentage changes and rankings are affected by continuity breaks in the series for a large number of economies, and by limitations in cross-country comparability.
Source: WTO and UNCTAD Secretariats.
Appendix Table 6
Leading exporters and importers in world trade in commercial services excluding intra-EU (27) trade, 2012
$bn and %
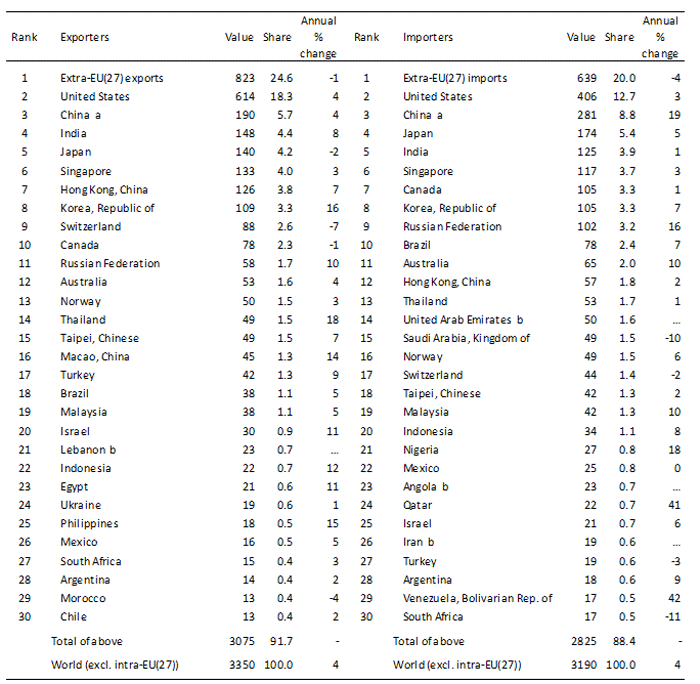
a Preliminary estimates.
b Secretariat estimate.
… indicates unavailable or non-comparable figures.
- indicates non-applicable.
Note: Figures for a number of countries and territories have been estimated by the Secretariat. Annual percentage changes and rankings are affected by continuity breaks in the series for a large number of economies, and by limitations in cross-country comparability.
Source: WTO and UNCTAD Secretariats.
Appendix Chart 1
Merchandise exports and imports of selected economies, January 2011-February 2013
Year-on-year % change in current $ values
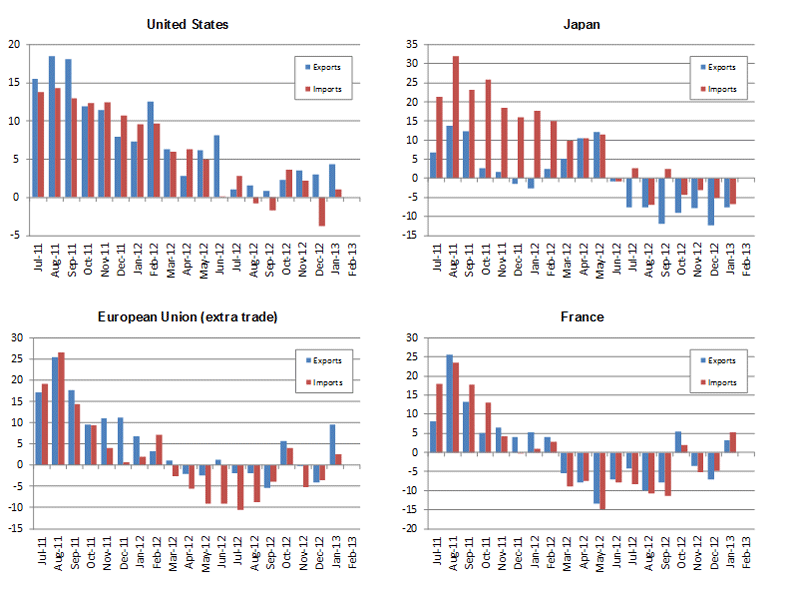
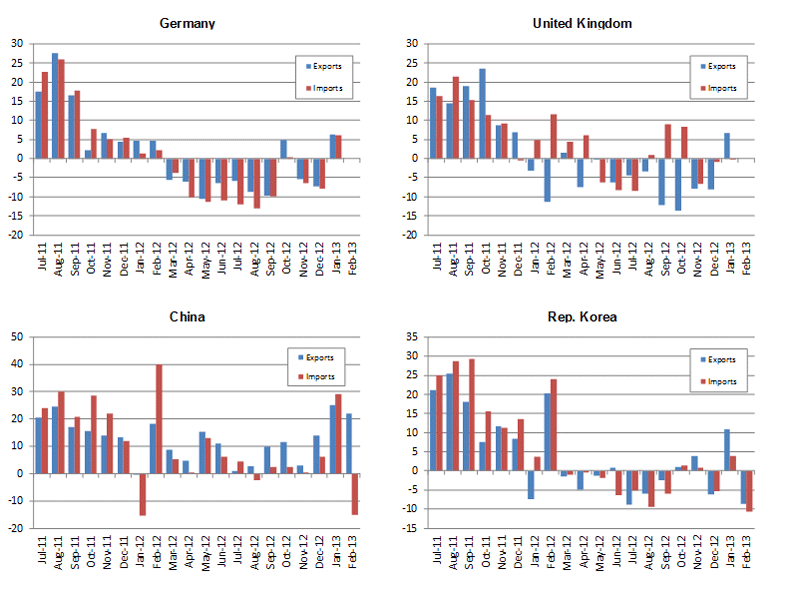
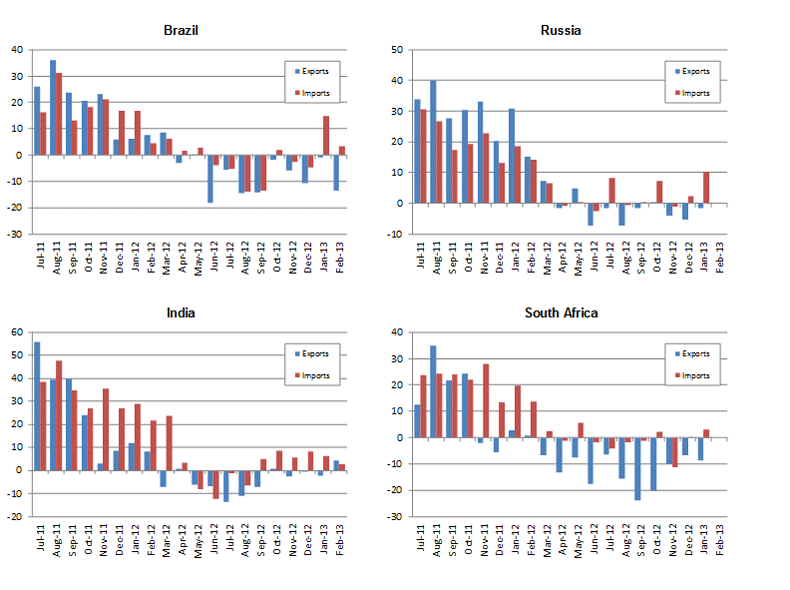
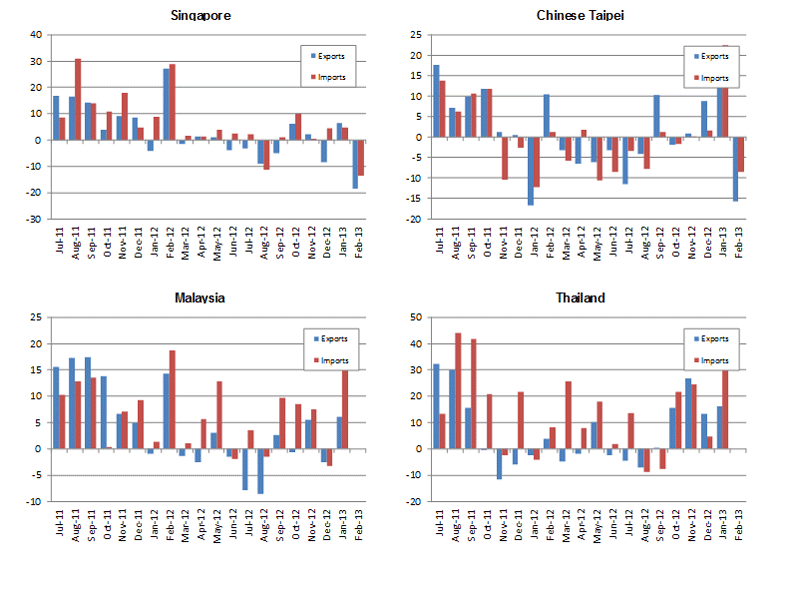
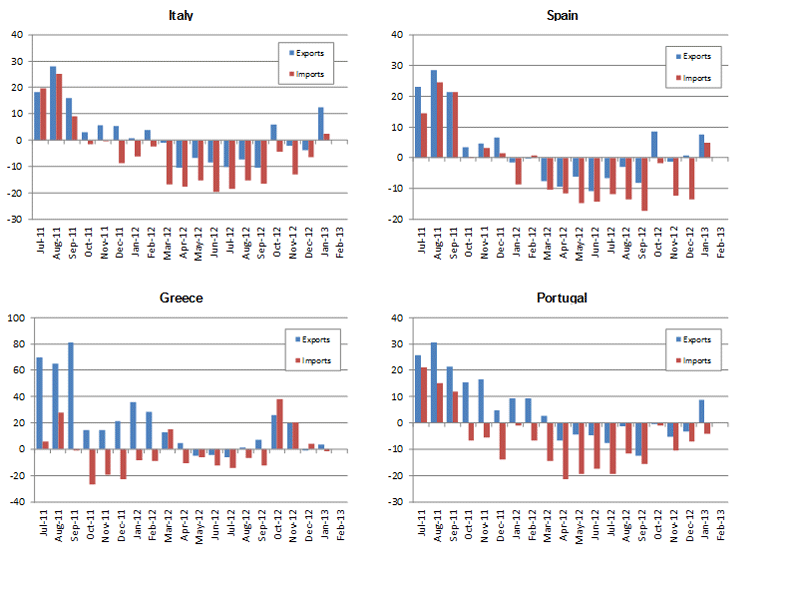
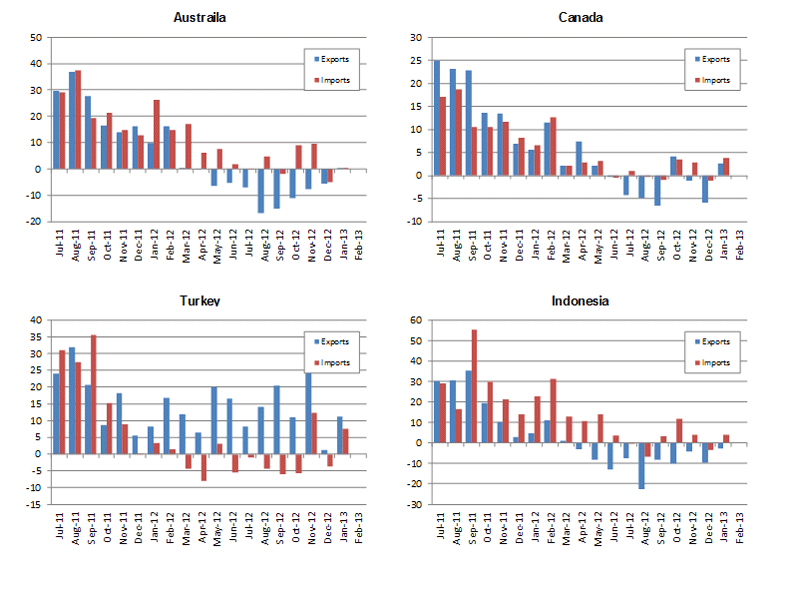
Sources: IMF International Financial Statistics, Global Trade Information Services GTA database, national statistics.
Notes:
1. Data for Singapore include financial intermediation services indirectly measured (FISIM). Back to text
2. The IMF World Economic Outlook, the OECD Economic Outlook, the UN DESA World Economic Situation and Prospects and other national and private sources. Back to text
3. Keck, Alexander, Raubold, Alexander and Truppia, Alessandro (2009) “Forecasting international trade: A time series approach’, OECD Journal: Journal of Business Cycle Measurement and Analysis, vol. 2: 157–176. The model has been extended and further improved since publication and also includes estimations for emerging economies, such as China.Back to text